

Identifying the main components of the psychrometric chart
The dry bulb temperature, shown in degrees centigrade, runs along the bottom horizontal axis. The vertical axis, to the right is the moisture content of air, expressed as kg of moisture per kg of air. There are three sets of diagonal lines running from top left to bottom right. The first is the Wet Bulb temperatures and is represented at the 100% saturation curve. The second is the specific volume, measured in m3/kg of air, again represented on the 100% saturation curve but dropping more steeply than the Wet Bulb. The third is the specific enthalpy, kJ/kg of dry air. Represented by the two outer scales of the chart. The curved lines running top right to bottom left represents the percentage of moisture in suspension relative to saturation. This is expressed as % relative humidity, (%RH). A further term that is used in relation to the 100% saturation line is Dew Point. This is a specific point within a process whereby condensation or wetting out will occur.
The humidification process revolves around Wet and Dry Bulb Temperatures, Moisture content, Relative humidity, Specific volume and the Dew Point. There will be a further Master Class that goes deeper into the psychrometric process but for this overview we need only understand the fundamentals.
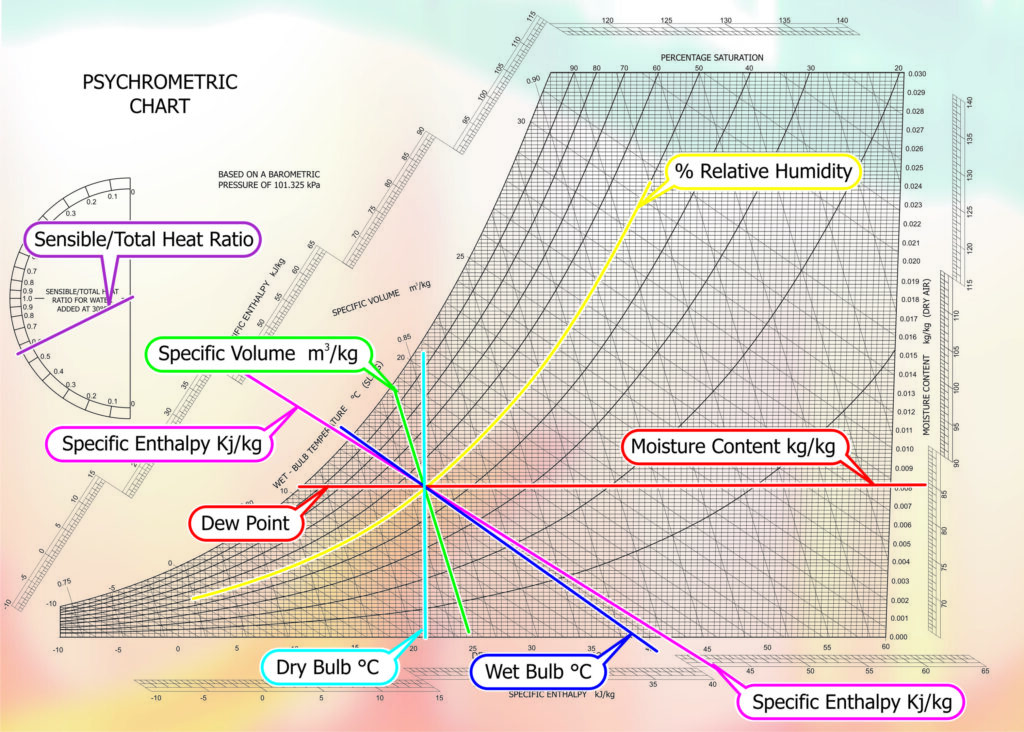
Fig. 1 – Psychrometric Chart Components
Air: Single process functions
Let us take a specific point within the psychrometric chart that represents an average space condition. 21oC Dry Bulb (DB), 14.8oC Wet Bulb (WB), 50% relative humidity (RH), .0079kg/kg moisture content (MC), .843m3/kg specific volume (SV). Applying sensible heat follows the horizontal MC line to the right effectively increasing the Dry Bulb temperature; decrease the relative humidity but maintaining a constant moisture content.
Dehumidification theoretically will reduce the moisture content and relative humidity whilst maintaining the Dry Bulb temperature. In practice this process will either heat or cool the air dependant on the type of system adopted. Diagonal lines will represent these processes to the right bottom, heating, or to the left bottom, cooling.
Sensible cooling reduces Dry Bulb temperature and follows the horizontal moisture content line to the left, effectively maintaining the moisture content but reducing the Wet and Dry Bulb temperatures and increasing the relative humidity.
Humidification can follow two paths dependant on the process adopted.
Adiabatic process follows the Wet Bulb line up towards the 100% saturation curve, ultimately arriving at the Dew Point. This process will reduce the Dry Bulb temperature whilst increasing the moisture content and relative humidity. This can be a very useful process for reducing energy in net cooling applications.
Isothermal process travels, to all intense and purpose, up the Dry Bulb line. This has the effect of increasing the moisture content and relative humidity with very little increase in the Dry Bulb temperature. Another useful process for adding moisture without increasing the cooling load
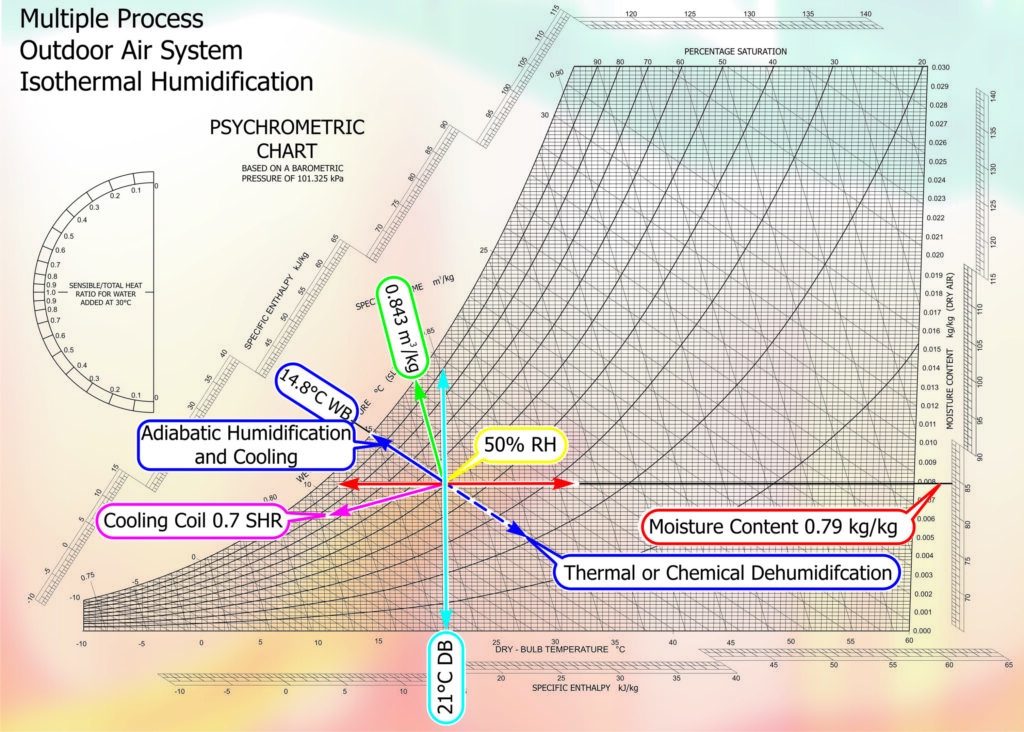
Fig. 2 – Psychrometric Chart Isothermal Humidification
Multiple process Outdoor Air system: Isothermal humidification
This is an example of isothermal humidification to a full ambient-air system. Taking outdoor air at 0ºC DB / 0oC WB (saturated) and increasing its temperature to 21ºC DB / 10.8oC WB, does not change the moisture content but would reduce the relative humidity to approximately 24%. The addition of 0.0040 kg of moisture per kg of air (.0079 – .0039) would be required to increase the relative humidity from 24 to 50%. During the addition of moisture there would be very little increase or decrease of Dry Bulb temperature.
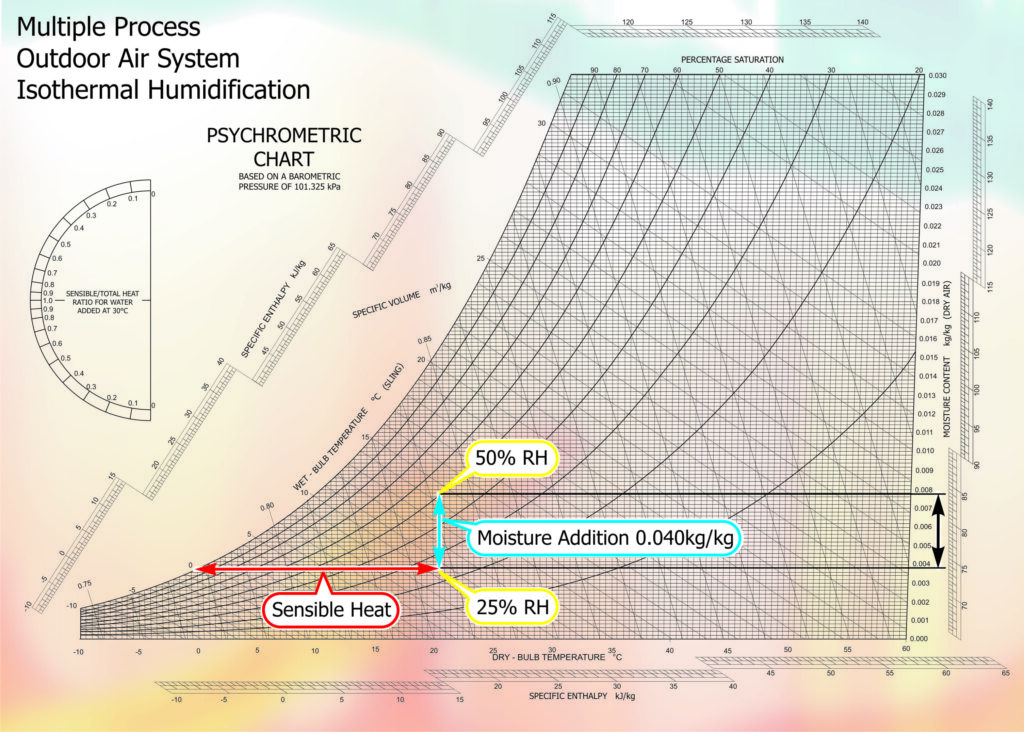
Fig. 3 – Psychrometric Chart Multiple Process
Multiple process Outdoor-air system: Adiabatic humidification
The adiabatic humidification process, starting from the same 0ºC DB / 0oC WB, sensible heated is added to increase the temperature to 21ºC DB. Applying the cold water moisture system would follow the Wet Bulb line up to 95% RH with a Dry Bulb temperature reduction to 11.3oC. We have added the same amount of moisture as with the Isothermal system, .004kg/kg of air. More sensible heat must be added to bring the air to the supply condition required. I.e. 21oC DB / 50% RH.
In practise the condition before the application of the second sensible heat, 95% RH is very close to the Dew Point and it is difficult to control at this high level, therefore another way would be to overheat the ambient air to 31oC DB / 14.8oC WB. Adding moisture, following the Wet Bulb line to the supply air condition corresponding to 50% RH. The same amount of heat has been applied but at one point rather than two. This has the effect of reducing the capital cost, as it will be a single large heater rather than two smaller ones. There is also a better chance of controlling the system without wetting out.
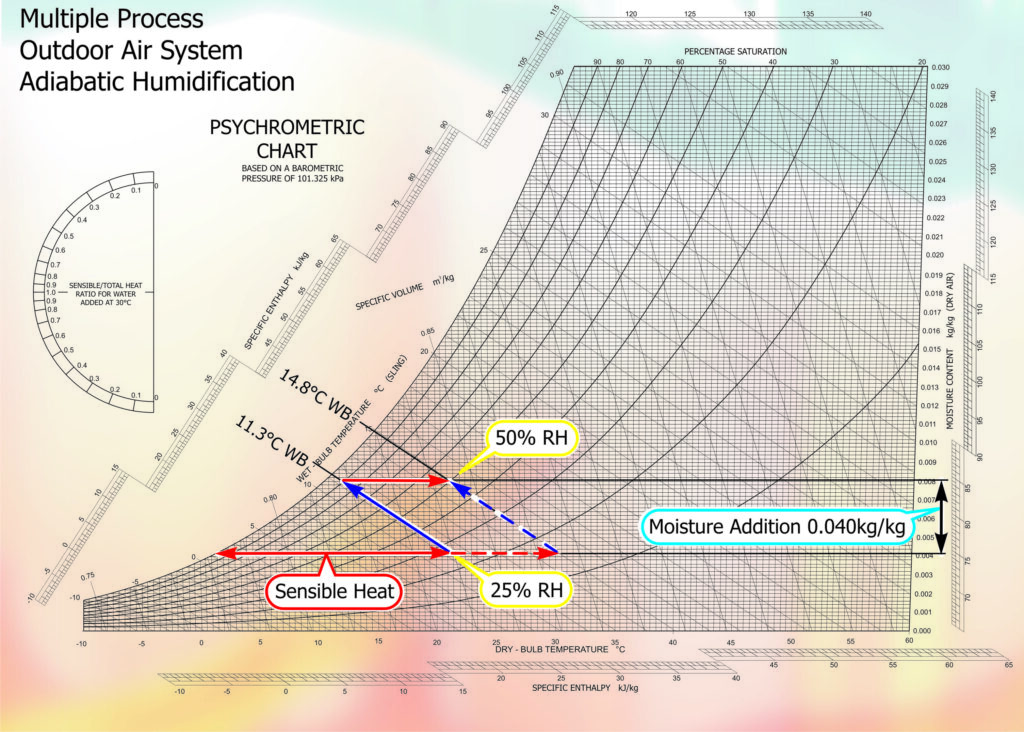
Fig. 4 – Psychrometric Chart Adiabatic Humidification
Psychrometric load calculations
Design criteria
For each example, the same design criteria are used.
| Outdoor air volume: 1m³/sec. | Outdoor: 0ºC DB/ 100%RH / 0.0038 kg/kg. MC |
| Specific volume: 0.832 m³/kg. | Indoor: 21ºC DB / 50% RH / 0.0079 kg/kg. MC |
| Moisture differential: 0.0079 – 0.0039 = 0.0041 kg/kg. |
It is worth noting that in any calculation only the outdoor - air intake would be considered, therefore this calculation would remain true if the total air volume was 10 m³/sec and the outdoor air proportion was 10%.
Calculation:
1 m³/sec × 0.0041 kg/kg × 3600 sec = 17.74 kg/hr.
0.832 m³/kg
The calculation uses the air volume at (1 m³/sec), multiplied by the moisture differential (.0041kg/kg) and the number of seconds in an hour (3600), then divided by the specific volume (.832m3/kg). The resultant value of 17.74 kg/hr can be used as a useful yardstick figure for the amount of moisture required for every 1 m³/sec of outdoor-air coming into a system.
It is worth pointing out the specific volume (.832m3/kg) used in this calculation is derived as the mean difference of the specific volumes at the start and finish of the process.
Power using steam
Heating
| Air at 0ºC/100%: | = 9kJ/kg. Air at 21ºC/25%: | = 31 kJ/kg |
| Power differential: | 31– 9 | = 22 kJ/kg |
| Therefore energy used = | 22kJ ÷ 0.832(SV) | = 26.44 kW (per m³/s) |
The amount of power required for the adiabatic and isothermal systems can be calculated. Both options require the initial temperature to be increased to 21ºC DB
Power using steam (Isothermal)
| Heating air from 0ºC DB/100%RH to 21ºC DB | Requires | 22 kJ/kg |
| Humidifying from 21ºC DB / 25% RH to 21ºC DB / 50%RH | Requires | 10 kJ/kg |
| Energy used for heating and humidity process | 32 kJ/kg | |
| Therefore power required for whole process = 32 x .832 m3/kg SV | 26.62 kW/m3 |
Power using water (Adiabatic)
| Heating air from 0ºC DB / 100% RH to 21ºC DB | Requires | 22 kJ/kg |
| The adiabatic cooling effect reduces the condition to 10ºC DB / Saturated | ||
| Therefore re-heating from 10ºC DB to 21ºC DB | Requires |
11 kJ/kg |
| Energy used for initial heating and re-heat | 32 kJ/kg | |
| Therefore power required for whole process = | 33 x .832 m3/kg SV | 27.45kW/kg |
Energy comparison
| Energy required in isothermal process | 26.62 kW |
| Energy required in adiabatic process | 27.45 kW |
This energy balance is a generalisation for a typical air conditioning application using a minimum quantity of outdoor air. There is little difference in the total power requirements of the two systems so any differentiation will be within the type of energy used to heat either the water for steam or air for reheat in the adiabatic process.
The Humidity Application Master Class later in this series will compare the variety of applications and the processes that can be used to give the optimum answer to a humidity problem.
NOTE: Our sincere thanks go to Mike Creamer of Business Edge Ltd. Re-creation of Drawings by Business Edge Ltd.
DISCLAIMER: Whilst every effort is made to ensure absolute accuracy, Business Edge Ltd. will not accept any responsibility or liability for direct or indirect losses arising from the use of the data contained in this series of articles.